大连理李新勇教授ACS Catal.:压电效应对氮化碳光催化生产H2O2的影响
大连理李新勇教授ACS Catal.:压电效应对氮化碳光催化生产H2O2的影响
利用压电效应调节H2O2人工光合作用中载流子的分离和输运是一种很有前途的方法。然而,对压电光催化效应的深入和全面的认识还远远不够。本文中,作者精确地调节了石墨氮化碳(CN)的分子结构,以研究压电对CN上光催化生成H2O2的影响。研究结果表明,压电效应在CN上光催化生成H2O2的作用很大程度上取决于CN的分子结构。其中,对于CN、磷修饰CN (CN-P)、氧官能化CN (CN- OF)和氰基接枝CN (CN- CA),由于压电效应,CN、CN-P和CN- OF的光催化活性分别提高了约1.40倍、1.46倍和1.51倍,而CN-CA的光催化活性降低了6.0倍。为了阐明和理解影响压电光催化活性的关键因素,采用密度泛函理论、光电化学测量和压电响应力显微镜测量来探索分子功能化CN的活性位点、压电极化和电荷分离。结果表明,压电效应对CN光催化产H2O2的影响是多种因素综合影响的结果。这项工作不仅证明了CN的分子结构决定了压电效应是否能提高CN上光催化H2O2的产率,而且揭示了压电效应对CN上光催化H2O2产率的作用机制。
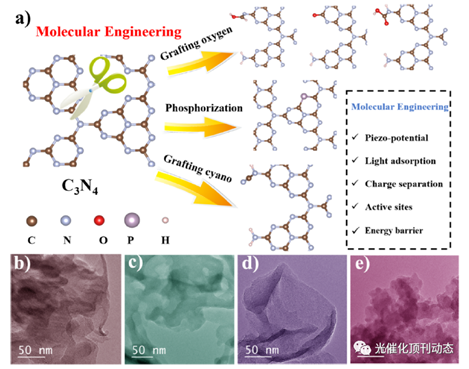
Figure 1. (a) Schematic illustration of molecular engineering of g-C3N4; TEM images of (b) CN, (c)CN-P, (d)CN-O, and (e) CN-CA.
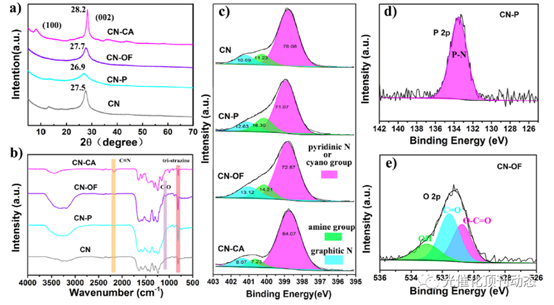
Figure 2. (a) XRD pattern, (b) FT-IR spectrum, and (c) N 1s XPS spectra of CN, CN-P, CN-OF, and CN-CA; (d) P 2p XPS spectrum of CN-P; (e) O 2p XPS spectrum of CN-OF.
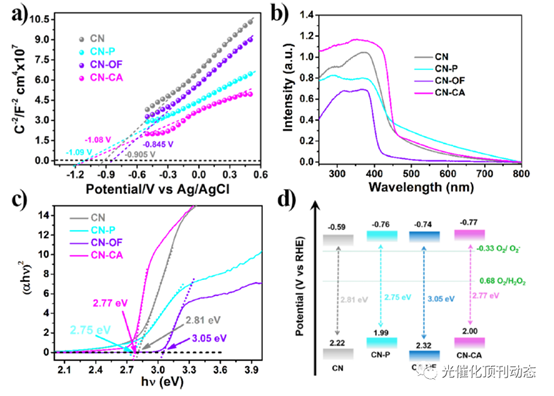
Figure 3. (a) Mott−Schottky plot and UV/vis absorption spectrum; (b) Tauc’s plots of (ahν)2 vs photon energy; (c) estimated band gaps through the Kubelka−Munk function; (d) schematic diagram of the band structure of CN, CN-P, CN-OF, and CN-CA.
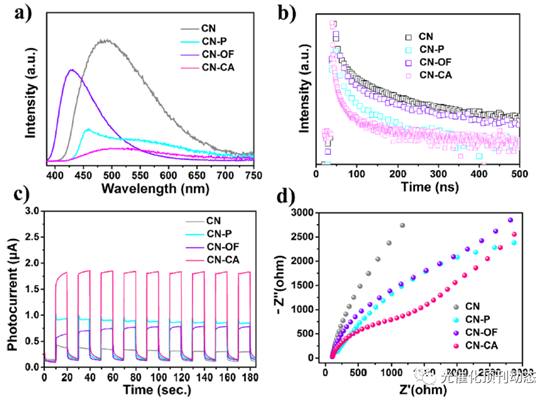
Figure 4. (a) Steady-state PL spectra, (b) time-resolved transient PL decay, (c) transient photocurrent spectra, and (d) EIS spectra of CN, CN-P, CN-OF, and CN-CA.
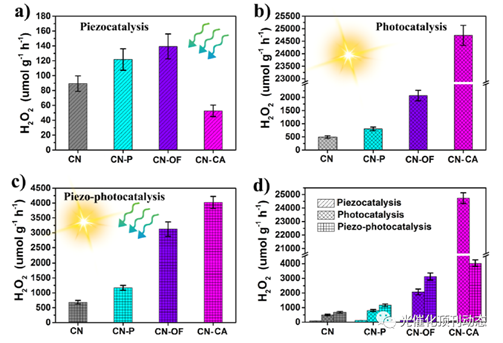
Figure 5. H2O2 production rate of CN, CN-P, CN-OF, and CN-CA in (a) piezocatalysis, (b) photocatalysis, and (c) piezo-photocatalysis; (d) comparison of performance of photocatalysis and piezo-photocatalysis.
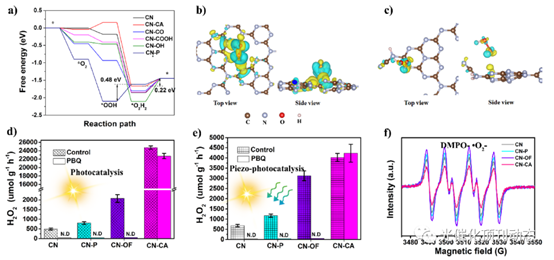
Figure 6. (a) Calculated energy profile for hydrogen peroxide production on different sites; charge density difference mapping between H2O2 and reaction sites: (b) CN and (c) CN-CA; the sky-blue and yellow isosurfaces stand for the negative and positive charges, respectively. The isosurface of charge density is set to 0.001 e Å−3 ; influence of PBQ during (d) photocatalytic and (e) piezo-photocatalytic H2O2 production on CN, CN-P, CN-OF, and CN-CA; (f) •O2 −−DMPO spin-trapping ESR spectra during H2O2 production.
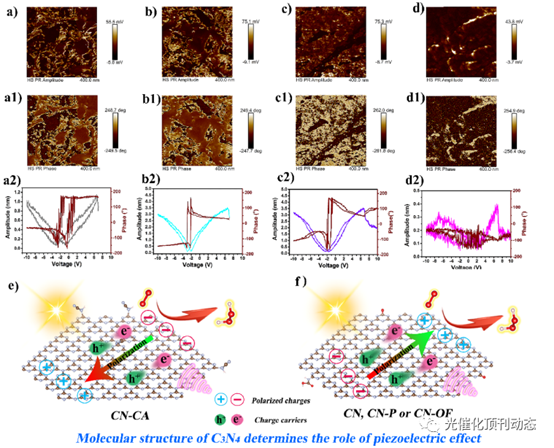
Figure 7. PFM images of CN: (a) amplitude image, (a1) phase image, and (a2) piezoresponse amplitude butterfly loops and phase hysteresis loops; CN-P: (b) amplitude image, (b1) phase image, and (b2) piezoresponse amplitude butterfly loops and phase hysteresis loops; CN-OF: (c) amplitude image, (c1) phase image, and (c2) piezoresponse amplitude butterfly loops and phase hysteresis loops; CN-CA: (d) amplitude image, (d1) phase image, and (d2) piezoresponse amplitude butterfly loops and phase hysteresis loops; (e) schematic mechanism of H2O2 production over CN-CA in piezo-photocatalysis; (f) schematic mechanism of H2O2 production over CN, CN-P, and CN-OF in piezo-photocatalysis.
Modulating the Molecular Structure of Graphitic Carbon Nitride for Identifying the Impact of the Piezoelectric Effect on Photocatalytic H2O2 Production
https://doi.org/10.1021/acscatal.3c02565


